
Business Central Telemetry With Power BI: How To Use Application Insights, Fix Blind Spots & Spot Performance Problems Early

Business Central Telemetry With Power BI: How To Use Application Insights, Fix Blind Spots & Spot Performance Problems Early

Imagine rolling a D20 every morning just to see if Business Central will behave. No telemetry? That’s like rolling blindfolded. In this episode, we start with that reality: admins and consultants trying to keep environments stable using only helpdesk tickets and vague “it’s slow” complaints, with no real visibility into sessions, deadlocks, or performance patterns. You’ll learn how to connect the Business Central telemetry feed to Azure Application Insights, why the one 36‑character Application ID in the Azure portal blocks more rollouts than any boss fight, and what changes in your day‑to‑day once those signals show up in Power BI as live dashboards instead of unreadable log walls.

WHY TELEMETRY IS YOUR HIDDEN MINI‑MAP

Telemetry is the hidden mini‑map you didn’t know you were missing. With it turned off, you’re not “keeping it simple”—you’re choosing to run blind: deadlocks stay invisible until payroll explodes, SQL latency creeps up over weeks, and misbehaving extensions quietly slow everything down. We walk through how telemetry captures behavior signals (sessions, page views, SQL durations, environment events) while leaving business data like invoices out of scope, why that matters for privacy, and how a single switch like “Skip Replication Counter Update” only becomes obvious once telemetry shows you the pattern behind the pain. Instead of reacting to disasters, you start seeing slopes and trends in time to schedule fixes on Tuesday afternoon instead of sacrificing your weekend.

CHOOSING THE RIGHT POWER BI APP (AND UNLOCKING REAL DATA)

Microsoft gives you two Power BI apps for telemetry—“Dynamics 365 Business Central Usage” and “Dynamics 365 Business Central App Usage”—and most admins install the wrong one for the question they’re asking. In this episode, we break down when to use the environment “Usage” app for system‑wide health (logins, client mix, performance across the tenant) and when to use the extension “App Usage” app to isolate a single customization’s behavior. You’ll learn the practical workflow: install from AppSource using the aka.ms shortcuts, understand why you see only sample data at first, and then plug in your own Application Insights resource so the dashboards light up with your real telemetry instead of mannequins. We also cover why a Power BI Pro license is non‑negotiable for live telemetry and how the automatically created workspace fits into your admin story.

THE AZURE PORTAL PUZZLE: FINDING THE APPLICATION ID

The final boss in this setup isn’t Business Central—it’s the Azure portal. We walk step‑by‑step through where the Application ID actually lives inside your Application Insights resource, why it never appears in Business Central or Power BI, and how to avoid chasing the wrong “ID” values for hours. Once you drop that ID into the Power BI app configuration, the portal maze suddenly pays off: sample dashboards flip over to live environment data, and your mini‑map fills in with real session, error, and performance streams. From there, we talk about access rights, why blank reports usually mean a permission problem rather than a broken setup, and how to share these insights with dev, ops, and leadership without drowning them in raw logs.

WHAT YOU’LL LEARN
  • Why Business Central without telemetry is like running your environment blindfolded.
  • How telemetry captures environment and extension behavior signals without exposing invoice or customer data.
  • How to choose between the “Usage” and “App Usage” Power BI apps—and when you actually need both.
  • How to connect Business Central telemetry to Azure Application Insights and locate the correct Application ID.
  • Why your dashboards only show sample data at first and how to switch them to live telemetry.
  • How to use Power BI telemetry reports (Usage, Errors, Performance, Administration) to spot deadlocks, SQL lag, and misbehaving extensions before users complain.
THE CORE INSIGHT

The core insight of this episode is that helpdesk tickets and error logs are too late in the story—you only hear about issues after they’ve already hurt someone. Telemetry turns Business Central into something you can actually observe: you see sessions, errors, and performance shifts as they form patterns, not just as isolated incidents. Once you wire Business Central to Application Insights and the right Power BI apps, you stop asking “why did it fail yesterday?” and start asking “what trend do we need to fix this week so it never fails at all.”

WHO THIS EPISODE IS FOR
  • Business Central admins who are tired of reacting to vague “it’s slow” complaints without real data.
  • Dynamics consultants and partners who need a repeatable telemetry setup across multiple customers.
  • IT and operations leads who want measurable system health instead of anecdotal feedback.
  • Developers building extensions who need to see how their apps behave in real customer environments.
ABOUT THE AUTHOR / HOST

Mirko Peters is a Microsoft 365 and Business Central‑focused consultant and host of the M365.FM podcast, helping organizations treat their Microsoft stack as an integrated operating system instead of a pile of disconnected apps. He works with teams running on Microsoft 365, Azure, and Dynamics to design architectures, governance, and observability patterns—so admins stop flying blind and start using telemetry, dashboards, and data‑driven workflows to keep their environments healthy.

Become a supporter of this podcast: https://www.spreaker.com/podcast/m365-fm-modern-work-security-and-productivity-with-microsoft-365--6704921/support.

Denne episoden er hentet fra en åpen RSS-feed og er ikke publisert av Podme. Den kan derfor inneholde annonser.

Episoder(801)

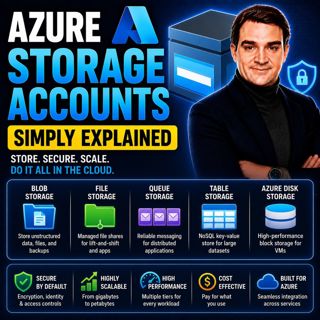
Azure Storage Accounts - Simply Explained

Azure Storage Accounts - Simply Explained

An Azure Storage Account is the foundation of Microsoft's cloud storage platform and acts as a single container that brings together multiple storage services under one roof. Rather than creating sepa...

18 Jul 13min
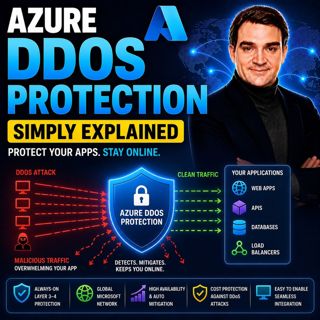
Azure DDoS Protection - Simply Explained

Azure DDoS Protection - Simply Explained

Azure DDoS Protection is Microsoft's managed service for defending internet-facing applications against Distributed Denial-of-Service (DDoS) attacks. These attacks attempt to overwhelm websites, APIs,...

18 Jul 16min

Azure Network Security Groups - Simply Explained

Azure Network Security Groups - Simply Explained

Azure DDoS Protection is Microsoft's managed service for defending internet-facing applications against Distributed Denial-of-Service (DDoS) attacks. These attacks attempt to overwhelm websites, APIs,...

18 Jul 14min
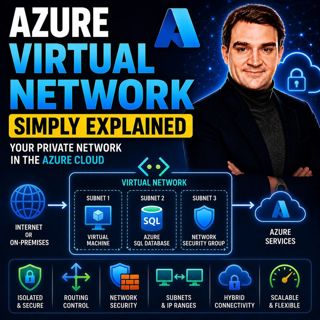
Azure Virtual Network - Simply Explained

Azure Virtual Network - Simply Explained

An Azure Virtual Network (VNet) is your own private network inside Microsoft Azure. It provides the secure foundation for virtually every cloud workload you deploy, including virtual machines, databas...

18 Jul 17min
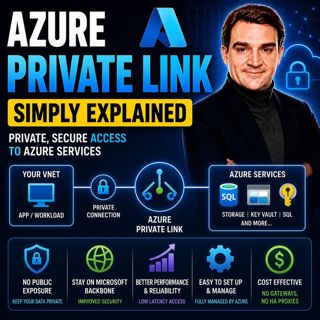
Azure Private Link - Simply Explained

Azure Private Link - Simply Explained

Azure Private Link is Microsoft's networking service that enables secure, private connectivity between your Azure Virtual Network and Azure Platform-as-a-Service (PaaS) resources such as Azure Storage...

18 Jul 16min
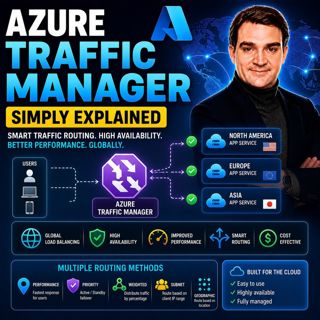
Azure Traffic Manager - Simply Explained

Azure Traffic Manager - Simply Explained

Azure Traffic Manager is Microsoft's global DNS-based traffic distribution service that directs users to the most appropriate application endpoint anywhere in the world. Instead of sending every user ...

18 Jul 16min
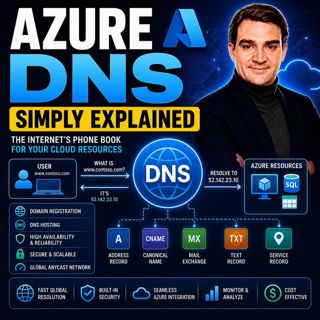
Azure DNS - Simply Explained

Azure DNS - Simply Explained

Azure DNS is Microsoft's fully managed Domain Name System (DNS) hosting service that translates human-friendly domain names like contoso.com into the IP addresses computers use to communicate. Instead...

18 Jul 15min
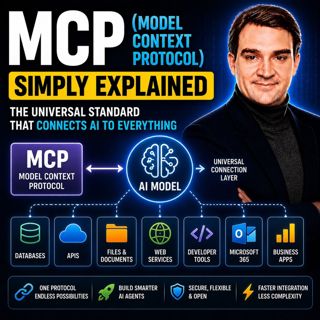
MCP (Model Context Protocol) - Simply Explained

MCP (Model Context Protocol) - Simply Explained

The Model Context Protocol (MCP) is an open standard that allows AI models to securely connect to external tools, applications, and data sources using a single, consistent protocol. Before MCP, every ...

17 Jul 15min

Populært innen Politikk og nyheter

giver-og-gjengen-vg
aftenpodden
aftenpodden-usa
fotballpodden-2
forklart
stopp-verden
popradet
rss-gukild-johaug
det-store-bildet
hanna-de-heldige
rss-ness
aftenbla-bla
nokon-ma-ga
dine-penger-pengeradet
rss-penger-polser-og-politikk
bt-dokumentar-2
lydartikler-fra-aftenposten
rss-utenrikskomiteen-med-bogen-og-grasvik
e24-podden
unitedno